|
CD Start Page | DATA ACQUISITION ONLINE Page | DATA ACQUISITION PRODUCTS Page |
|
CD Start Page | DATA ACQUISITION ONLINE Page | DATA ACQUISITION PRODUCTS Page |

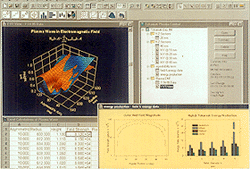
Scientists and Engineers choose SigmaPlot for the technical data analysis and graphing features they need--and for the total flexibility they want. Clear, precise technical graphs help you gain new insights into your data and help you best present your conclusion.
Create and customize the exact technical graph you want.
SigmaPlot goes beyond financially oriented spreadsheets and the "bells and whistles" of business graphing software by making the technical features you need the highest priority. Choose from a full range of graph optionstechnical axis scales, multiple axes, error bars, and automatic regressions and much more.
Flexibility to Graph Your Way
SigmaPlot gives you the flexibility to customize all graph attributes. For example, you can create asymmetric error bars, specify different colors, sizes, and symbols for each data point, and insert
axis breaks.
Powerful Data Analysis, Large, Scientific Data Worksheets
You can import almost any file into SigmaPlot's huge, scientific worksheet with the click of a toolbar button. SigmaPlot instantly generates summary statistics
everything from standard deviations to 99% confidence intervals.
Time-Saving Transform Language
SigmaPlot's mathematical transform language allows you to perform complex analysis and then automate them into effortless routines.
Powerful Curve Fitting
For fast, straightforward curve fitting, SigmaPlot automatically solves and graphs polynomial regressions up to 10th order and 95% or 99% confidence and prediction intervals.
For more complex curve fitting, SigmaPlot also includes a powerful, robust nonlinear curve fitter -- up to 10 independent variables and 25 parameters.
SIGMAPLOT 4.0 FOR WINDOWS FEATURES:
OLE 2 Integration and Convenience
SigmaPlot's graphing page is both an OLE 2 server and container. You can use Word's Equation Editor, WordArt, or any other OLE object inside your graph page to annotate your work. Or you can embed your SigmaPlot graphs in Word documents and edit them directly inside your document. Also, you can open a Microsoft Excel spreadsheet inside SigmaPlot- Excel's menus will blend seamlessly with SigmaPlot's.
New Visual Display Graph Library for Windows
This new graph library includes the book The Visual Display of Quantitative Information, style guidelines, data density meter, fonts, and numerous graph templates. Now it is even easier to create precise and professional graphs that best present your results!
2D
Scatter, line, bar, polar, pie, needle, quadrant, ternary, histogram
3D
Multiple, intersecting plots with hidden line removal, smooth or discrete shading, 3D rotation, perspective preview, and light source shading
Scatter, bar, 3D line, mesh, contour
Graphs created through transforms:
Ternary, Gaussian, Area, Z-Plane, Vector, Histograms
Technical Axes:
Types
linear, log, probability, polar
Axis Features
Control of display, thickness, color, range, axis breaks, offset axes, automatic titles
Error Bars:
Standard deviation
Standard error
95% or 99% confidence
User-defined - pick error bar values from column
Multiline Text Editor:
Control font size, style, color, Greek, multiple levels of
superscript & subscript, 360 degree rotation, left, right, ¢er justification, and spacing between lines
Grids
Control of color, line type, thickness, and display of major & minor grids in X & Y direction
Symbols
Control color, size, shape, layering and the use of letters and numbers as symbols
Linear and Nonlinear Regressions
Nonlinear Regressions:
Marquardt-Levenberg algorithm with up to 10 independent variables and 25
parameters with the option to define constraints, tolerance, step size, and iterations
Automatic Linear and Polynomial Regressions:
Up to 10th order with confidence and prediction intervals and regression statistics
Column Statistics Generated Automatically:
Automatically generate summary statistics for each worksheet column
Mathematical Transforms:
One-way ANOVA
Fast Fourier Transforms with filters
Lowess smoothing
Differential equations
Data to rgb-color transform
Trigonometric and Algebraic functions
Statistics including skewness, 95% and 99% confidence, t-tests Random and Gaussian Random number generation Range, Accumulation, Precision, and more.
Large, Scientific Worksheets:
Over one billion data points in 16,384 columns by 65,436 rows
Automatically generate column statistics
Data sorting
Use Excel as worksheet
Multiple worksheets per session
Page Layout and Annotation Options:
Automatic or manual legends
True WYSIWYG
Multiline text with all available Windows fonts, sizes, colors, and styles
Multiple curves on one graph
Multiple axes on one graph
Multiple graphs on one page
Multiple pages per worksheet
Multiple levels of zooming and custom zooming
Scale graph to any size
Import and Export:
ASCII text files
1-2-3
Symphony
Quattro
Excel
dBASE
SigmaPlot for DOS 4.0, 4.1, 5.0
SigmaPlot for Windows 1.0, 2.0
SigmaPlot for Macintosh 4.1
OLE 2 container and server
Excel worksheet activation using OLE 2
Any Windows printing device
Catch metafile export utility
DIF, TIF, WMF<BMP, JPEG
SigmaLinking:
SigmaPlot and SigmaStat share data effortlessly
though SigmaLink dynamic data linking technology
System Requirements: IBM 486 or higher, Windows 3.1 with Win 32s
(Windows 32-bit extensions),
Windows 95, Windows NT, 16 MB RAM, 20 MB hard disc space
(25 MB for Windows 3.1), and at least 30 MB swap file.
Visual Display Graph Library requires
an additional 4 MB hard disc space, Microsoft compatible mouse.
COPY [To Your Hard Drive] Sigmaplot Demo Software Now!
VIEW an Adobe Acrobat pdf file for more product info (requires Acrobat Reader).
|
| |||||